When using a pyranometer for measuring, it is important to take a few moments to understand how it works and the various factors that impact its measurements. To select the most appropriate pyranometer and to ensure that the data which is collected is suitable for the actual measurement requirement, a good understanding of these basics is essential.
What Is a Pyranometer and Why It is Important for PV Projects?
Brief introduction to pyranometer
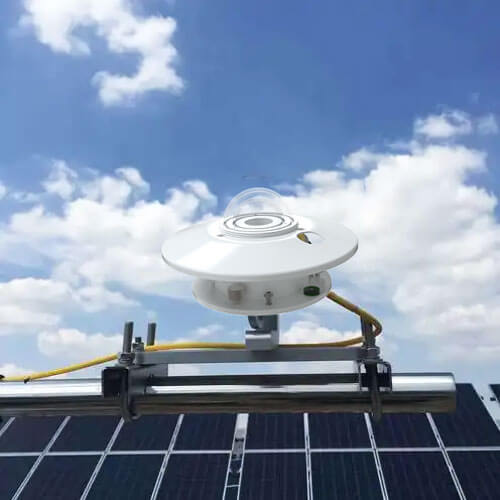
Pyranometer is a device to measure the total solar radiation energy received on a horizontal surface which is known as “Global Horizontal Irradiance (GHI)”. The simple operation of the device is to capture the sun’ s energy from the entire hemispherical field of view, transform the captured energy into an electrical signal, and then report the energy in terms of irradiance (W/m²).
Importance to photovoltaic systems
1. Pre-construction phase: site selection and project evaluation
Prior to construction, deploying pyranometers at candidate sites for 3-12 months of long-term monitoring allows for the collection of data such as the area’ s annual total irradiance, effective sunshine hours, and irradiance variations under extreme weather conditions. This data forms the basis for power generation forecasts and project feasibility analyses.
For example: If a site has an annual total irradiance of 1,200 kWh/m² or higher and consistent sunlight, it is an ideal location for a solar power plant.
2. Operational phase: fault diagnosis and performance monitoring
During operation, data from pyranometers can be used to calculate the Performance Ratio (PR), monitor the plant’s degradation, and detect issues such as shading or equipment failures early on. This maximizes uptime and revenue.
3. Asset level: asset valuation and data analysis
Measurement data from pyranometers can generate traceable historical records used for project feasibility studies, asset valuation, and verification of power generation performance guarantees, thereby reducing investment risks. At the same time, this data serves as input for analysis, supporting power generation forecasts, long-term performance modeling, and optimized revenue projections, and ensuring the reliability of grid and financial planning.
Types of Pyranometers and Their Working Principles
Two types of pyranometers
Based on their operating principles, pyranometers are primarily classified into two types: thermopile and silicon photocell. Thermopile-type meters use blackened thermopile sensors, which have a flat spectral response and are suitable for measurements across the entire solar spectrum; they are the standard instruments for professional measurements. Silicon photocell type meters use photodiode detectors, whose spectral response range is similar to that of photovoltaic cells, making them particularly suitable for monitoring the efficiency of photovoltaic systems.
In photovoltaic power plants, horizontally mounted pyranometers are used to monitor global horizontal irradiance (GHI), which is a key metric for evaluating plant efficiency, assessing solar resources, and making short-term power generation forecasts. Models such as the Renkeer RS-TBDS-N01-1-T are particularly well-suited for monitoring the efficiency of photovoltaic systems because their spectral response is similar to that of photovoltaic cells.
How it works?
Thermopile based pyranometers working principle: When the sun is incident on the sensor surface, a temperature difference is created between the hot junction (absorbed surface) and the cold junction (instrument housing), producing a small voltage signal proportional to the irradiance level which is then converted to Global Horizontal Irradiance (GHI) value.
Silicon photocell based pyranometers working principle: It is based on the “photovoltaic effect” of silicon cells which when exposed by light, directly produces a photocurrent, the value of which depends on the incident radiant flux. The spectral range is about 350-1150 nm, which is close to the spectral range of crystalline silicon modules.
What Are the Different Classes of Pyranometers?
ISO 9060 is the global standard for the classification of pyranometers. It was revised in 2018, and its testing requirements are more stringent than those of the 1990 version. The photovoltaic performance monitoring standard IEC 61724-1 directly references this standard. Therefore, solar projects seeking financing typically require certification to ISO 9060:2018, rather than merely a manufacturer’ s accuracy statement.
The previous classification (Class 1 and Class 2) is replaced by ISO 9060:2018, which includes Classes A, B and C. This classification is made based on the performance parameters such as response time, offset, instability, nonlinearity, direction response, spectral error, temperature error, and tilt response. The requirements are increasingly critical from class C to class A. Please see the table below for specific requirements:
| Parameter | Class A | Class B | Class C |
|---|---|---|---|
| Response time(95%) | ≤15s | ≤30s | ≤60s |
| Zero offset a (thermal, 200 W/m²) | ≤7 W/m² | ≤15 W/m² | ≤30 W/m² |
| Zero offset b (temp, 5 K/h) | ≤2W/m² | ≤4W/m² | ≤8W/m² |
| Non-stability (drift/year) | ≤0.8% | ≤1.5% | ≤3% |
| Non-linearity(100-1000W/m²) | ≤0.5% | ≤1% | ≤3% |
| Directional response(0-80°) | ≤10 W/m² | ≤20 W/m² | ≤30 W/m² |
| Typical use | Bankable PV, research | Commercial PV, agri-met | Basic weather, education |
- Class A: the tightest tier, required for utility-scale PV monitoring and research-grade stations.
- Class B: a practical middle ground for most commercial PV plants and agricultural monitoring.
- Class C: adequate for general weather stations, education, or budget PV sites.
Difference Between a Pyranometer, Pyrheliometer, Pyrgeometer and a Solar Radiation Sensor
Pyranometer vs Pyrheliometer
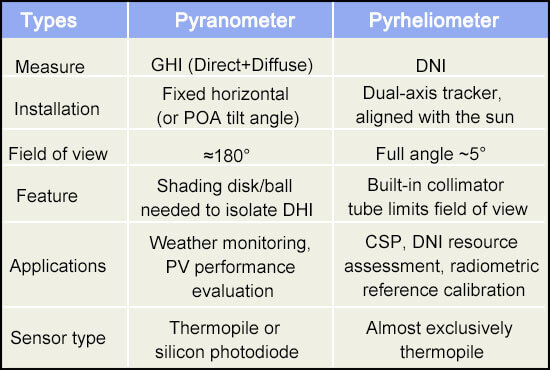
Pyranometer is a horizontal mount instrument to measure global horizontal irradiance (GHI) that consists of both direct and diffuse radiation. A pyrheliometer measures direct normal irradiance (DNI) at an angle perpendicular to the sun’s rays, and requires a sun tracker to keep it continuously facing the sun.
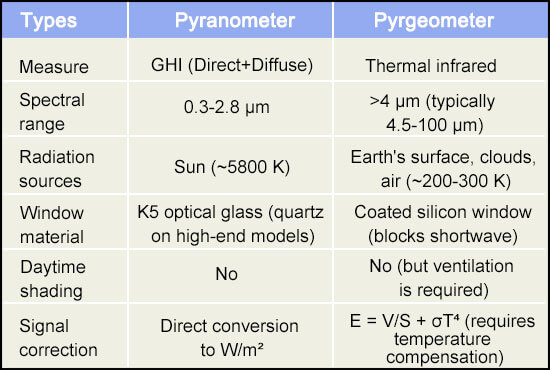
Pyranometer vs Pyrgeometer
The spectral bands and radiation sources measured by the two instruments are completely different. A pyranometer measures shortwave solar radiation (wavelength range approximately 0.3-3 μm). A pyrgeometer measures infrared thermal radiation emitted by the Earth’s surface, the sky, and the atmosphere (wavelength range >4 μm).
Pyranometer vs Solar Radiation Sensor
“Solar radiation sensor” is a general term that encompasses all devices capable of measuring the intensity of sunlight. This broad category includes everything from professional-grade pyranometers that comply with the ISO 9060 standard to simple silicon photodetectors costing a few dozen dollars each, and even some photovoltaic reference cells. There are no uniform accuracy standards or mandatory ISO classification requirements for these devices.
What Are the Sources of Error in Pyranometer Measurements?
Zero offset: Caused by a combination of long-wave radiation loss from the “cold sky” at night and rapid changes in ambient temperature. This effect is most easily observed at night and during periods of low irradiance, and can significantly amplify relative errors in measurements of low irradiance or diffuse radiation. Class A has the strictest limit (zero offset a ≤7 W/m²), while Class C has the most lenient (≤ 30 W/m²).
Cosine error: Error from the ideal cosine curve when the incident angle is different than the normal, which is worse at low solar elevations. ISO 9060 sets limits by class: Class A ≤10 W/m², Class B ≤20 W/m², Class C ≤30 W/m² (all under conditions of 1000 W/m² and an incident angle of 0-80°).
Spectral selectivity error: Ideally, the spectral range 300-2800 nm should be covered (for the thermopile-type sensors), but variations in transmittance of the glass cover or non-uniform absorption of the coating can affect the response in wavelength bands. The spectral error of standard instruments is about ±1% (Class B level) and that of high quality instruments is within ±0.2% to 0.5% (Class A level).
Temperature sensitivity: sensitivity changes according to the temperature of the ambient system. The normal testing range is from -20℃ to 50℃, and the Class A range is about ±2%, the Class C range may be ±3% or larger. This is more likely to happen with lower grade sensors that do not have a good compensation circuit.
Nonlinearity and annual stability: Output nonlinearity under high irradiance (in the 100-1,000 W/m² range) is ≤0.5% for Class A, ≤1% for Class B, and ≤3% for Class C; annual drift (long-term stability) is ≤0.8%/year for Class A, ≤1.5%/year for Class B, and ≤3%/year for Class C, which directly affects the comparability of long-term data.
Tilt response error: When installed at an angle (e.g., POA tilt), a coupling error exists between the geometric projection and the sensor’ s actual response; high-quality models typically limit this to around 1%.
Condensation and contamination: Water accumulation, dust, or bird droppings on the glass cover directly reduce transmittance. Failure of the internal desiccant can cause condensation, further exacerbating zero-point drift. This is a purely physical form of signal attenuation and does not constitute a sensor malfunction.
FAQs
How should a pyranometer be installed?
The area above the surface of the pyranometer should be free of obstructions. Avoid blocking direct sunlight at all times. Do not place the pyranometer near light-colored walls or other reflective surfaces. Do not expose it to artificial sources of radiation such as lamps.
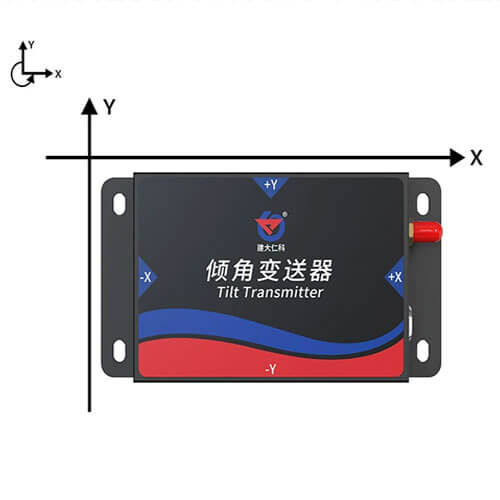
Why does pyranometer tilt affect irradiance measurement?
Because tilting changes the angle between the sensing surface and the incident sunlight, it reduces the effective luminous flux received, resulting in lower or distorted irradiance measurements.
Can a few degrees of pyranometer misalignment cause significant measurement error?
As long as the installation angle deviation is controlled within ±1°, there is generally no need to worry. What really needs to be considered is the cosine error when the solar incidence angle exceeds 60-70°, which is one of the most important indicators to pay attention to when selecting sensor grade.
How does pyranometer cosine response affect GHI measurements?
The cosine response bias directly leads to a systematic underestimation of the GHI measurement as the solar altitude angle decreases, with the error being significantly amplified, especially during the early morning and late evening low-angle periods.
Why does a pyranometer need two glass domes?
The core purpose of using a double-layered glass cover in the pyranometer is to reduce measurement errors:
- Suppressing air convection: A static air insulation layer is formed between the two layers, blocking external airflow from directly impacting the sensing surface and preventing convective heat transfer from interfering with the thermopile temperature difference signal.
- Blocking the outer cover’s own infrared radiation: The outer glass layer heats up when exposed to sunlight and emits long-wave (infrared) radiation. The inner cover blocks this secondary radiation from reaching the sensing surface, preventing it from being misinterpreted as solar radiation energy.
How often should a pyranometer be recalibrated?
There is no fixed recalibration cycle for pyranometers. It must be determined comprehensively based on the instrument type, accuracy class, working environment, and standard requirements. General recommended cycles:
- Routine meteorological/photovoltaic monitoring scenarios: Calibrate once every 1-2 years.
- High-precision instruments: Can be extended to 5 years provided performance is stable.
- Ordinary Class II or Class C instruments, under harsh environments (high temperature, high humidity, high dust): Recommended ≤1 year, in severe cases requiring semi-annual or even quarterly calibration.
Why is POA irradiance important for PV performance monitoring?
POA (Plane of Array) is the core benchmark for photovoltaic performance monitoring because it directly reflects the total amount of solar radiation actually received on the surface of the module. It is the only effective input for calculating theoretical power generation, evaluating conversion efficiency, and diagnosing faults.
What are the core functions of a pyranometer?
- Real-time monitoring of total solar radiation: A pyranometer continuously records the sum of direct radiation, diffuse radiation, and reflected radiation, helping meteorologists analyze changes in climate patterns. For example, through long-term data comparison, scientists have discovered a declining trend in solar radiation intensity in certain regions, which may be related to air pollution or cloud thickening.
- Supporting efficiency assessment in the solar energy industry: In photovoltaic power plant construction, a pyranometer is a key tool for assessing power generation potential. By measuring radiation values at different times, the theoretical power generation of solar panels can be calculated, providing a basis for site selection and equipment selection. Statistics show that accurate radiation data can increase the return on investment of photovoltaic projects by approximately 15%.
- Serving agricultural and ecological research: Plant growth depends on photosynthesis, and photosynthetic efficiency is closely related to solar radiation intensity. A pyranometer can help farmers optimize crop planting layouts, such as planting sun-loving crops in sunny areas and shade-tolerant varieties in shady areas. Furthermore, it can monitor the light energy utilization efficiency of ecosystems such as forests and grasslands, providing data support for ecological protection.

This article was written by the Renke Technical Team. With extensive experience in the development and application of pyranometers, the team focuses on translating measurement principles, technical standards, and field experience into practical guidance for engineers and system integrators. This article reflects Renke’s technical expertise in pyranometer technology, solar radiation measurement, and photovoltaic monitoring, with the aim of helping readers better understand measurement accuracy, sensor selection, installation, and data reliability.