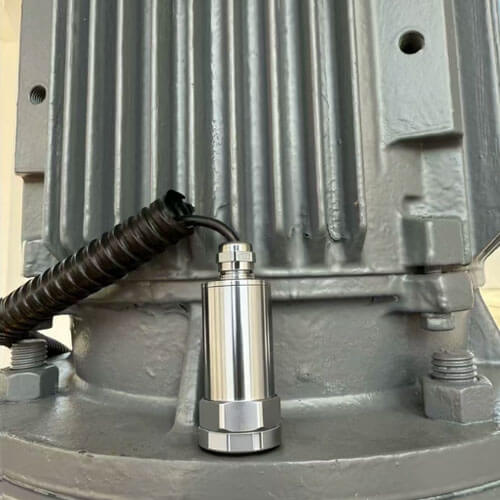
Vibration monitoring is an effective method for assessing the condition of mechanical equipment and performing fault diagnosis. By installing vibration sensors with an appropriate frequency response range at critical locations such as bearing housings, vibration data can be accurately collected, ensuring that key characteristic frequencies generated during operation are captured. Intelligent software then analyzes the vibration data to identify fault locations and enable timely maintenance.
What is frequency response range?
Frequency response range refers to the effective frequency range within which a vibration sensor can fully capture various characteristic frequencies during equipment operation. The upper limit of the frequency response determines the sensor’s ability to detect high frequency vibrations and impact signals, making it a critical parameter for early fault detection in components such as bearings and gears.
Why is a frequency response upper limit of 10 kHz typically required for vibration monitoring?
In vibration monitoring and condition diagnostics, the choice of frequency response range directly determines the types of faults a system can detect and the depth of diagnosis. In practical engineering applications, vibration accelerometers are generally required to have an upper frequency limit of no less than 10 kHz. This requirement is not arbitrary but is closely related to the vibration frequencies commonly associated with faults in industrial equipment.
During equipment operation, different types of faults produce vibration signals in different frequency ranges. Problems such as rotor imbalance, misalignment, and structural looseness usually manifest as low or mid frequency vibrations, with characteristic frequencies generally ranging from tens to several hundred hertz. By contrast, early faults in critical components such as bearings and gears(like poor lubrication, pitting, spalling, or tooth surface wear) generate vibration signals with pronounced high frequency characteristics and strong impacts. The effective characteristic frequencies of these signals often fall in the range of several kilohertz or higher.
If the upper frequency response of a vibration sensor is insufficient, even when the equipment exhibits high frequency fault characteristics, these critical signals can be severely attenuated or completely lost during measurement, ultimately preventing timely fault detection. Therefore, in vibration monitoring systems focusing on bearing and gear fault diagnosis, sensors with an upper frequency response of 10 kHz or higher have been widely validated in engineering practice.
Does this mean that low frequency response sensors cannot be used for vibration monitoring? The answer is no. Low frequency sensors are not “unusable,” but their applicable range differs. For monitoring tasks aimed at assessing overall operating conditions, such as rotor imbalance, misalignment, mechanical looseness, or structural resonance, the main characteristic frequencies are concentrated in lower frequency bands. In such cases, vibration sensors with a lower upper frequency response can still provide effective and reliable monitoring results. These applications prioritize trends in vibration amplitude rather than high frequency impact signals.
Therefore, in practical engineering, the choice of frequency response range should align with the monitoring objectives rather than simply pursuing “the higher, the better.”
How to set the optimal frequency response range?
“Being able to sense” does not necessarily mean “being able to acquire effectively.” In vibration monitoring systems, a frequently overlooked issue is that just because a sensor can respond to a certain frequency, it does not mean that the data acquisition system can effectively capture vibration signals at that frequency. To achieve effective acquisition of high frequency vibration signals, it is not sufficient for the sensor alone to have an adequate frequency response range; the sampling frequency of the data acquisition system must also be properly configured.
The sampling frequency of the acquisition system must comply with the Nyquist-Shannon Sampling Theorem, meaning it should be more than twice the highest frequency of interest to prevent aliasing. However, in practical engineering applications, because anti-aliasing filters have a transition band near the cutoff frequency, setting the sampling frequency according to the theoretical twofold relationship may still introduce spectral distortion.
To fully suppress the impact of the transition band of the anti-aliasing filter on frequency aliasing, engineering practice typically sets the sampling frequency to 2.56 times or higher than the highest frequency of interest. Under this condition, the signal can be reliably ensured to remain free from aliasing within the frequency band of interest.
Therefore, assuming the sensor has a sufficiently high frequency response range, the highest vibration frequency that can be effectively acquired in a vibration monitoring system can be approximately expressed as:
Effective Highest Frequency ≈ Sampling Frequency(fs) ÷ 2.56
For example, for a vibration sensor with an upper frequency response of 10 kHz, if the goal is to fully capture effective vibration signals within the 10 kHz range, the sampling frequency(fs) should be set to at least 10 kHz × 2.56=25.6 kHz. Only under this configuration can the acquisition system ensure that the highest frequency of effectively acquired vibration data reaches 10 kHz. If the sampling frequency is set too low, for instance fs=5120 Hz, the highest frequency that the system can effectively capture would be: 5120 ÷ 2.56 ≈ 2000 Hz.
In this case, even though the vibration sensor itself has a frequency response capability of 10 kHz, high-frequency fault information between 2000 Hz and 10 kHz will still not be captured or analyzed, rendering high-frequency vibration monitoring practically meaningless.
Typical case analysis
Below, we illustrate the necessity of a sensor having an upper frequency response of at least 10 kHz through specific fault types.
1. Bearing lubrication deficiency
Lubrication deficiency is one of the most common faults in rolling bearings. Its fault characteristics are mainly reflected in the high frequency range of the spectrum. In this range, the spectrum shows pronounced energy peaks with an elevated baseline, forming a “weed-like” pattern. The figure below shows spectral data from a feed pump bearing with lubrication deficiency, provided by a Renke client company.
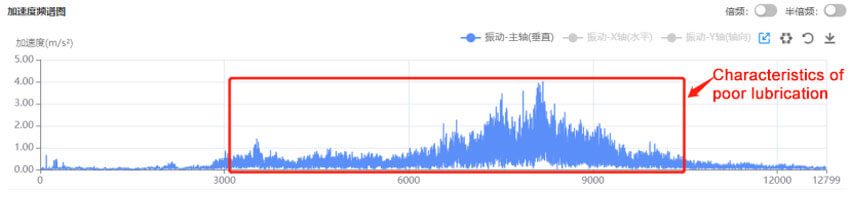
As observed in the spectrum above, the characteristic frequencies associated with lubrication deficiency occur around 3000-10000 Hz. In practical vibration monitoring, only sensors with a frequency response of no less than 10 kHz can effectively detect the fault features of bearing lubrication deficiency.
2. Bearing wear
Bearing wear is a typical high frequency impact-type fault. When wear or local defects appear on the outer race of a bearing, the rolling elements periodically pass through the defective area, generating impact forces at the moment of contact. This, in turn, excites high frequency vibration responses in the structure. In the frequency domain, these impact signals do not appear as a single spectral line but form a continuous band in the high frequency range of the acceleration spectrum, with intervals corresponding to the outer race defect frequency.
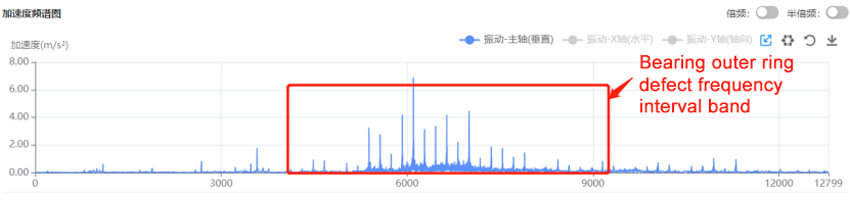
As seen in the acceleration spectrum of the motor drive-end bearing outer race wear shown above, there are distinct defect frequency bands in the high frequency range below approximately 9 kHz. This indicates that the outer race defects are continuously exciting the system with impacts, significantly enhancing high frequency vibration energy and exhibiting the typical spectral characteristics of bearing wear.
3. Gear faults
Gear transmission is one of the most common power transmission methods in rotating machinery. Consequently, gear faults are a typical type of failure in transmission systems, occurring relatively frequently and having a significant impact on equipment operation. In engineering practice, gear faults are typically identified based on the gear mesh frequency (GMF) and by assessing whether modulation sidebands appear on either side of the mesh frequency. The Gear Mesh Frequency is calculated as:
Gear Mesh Frequency=Gear Rotational Speed × Number of Gear Teeth
When gear tooth surfaces experience wear, pitting, or localized damage, the contact stiffness during meshing varies periodically, exciting vibration components primarily at the mesh frequency and its harmonics. In the acceleration spectrum, such faults typically manifest as significant amplification of multiple orders of the gear mesh frequency, accompanied by modulation sidebands on both sides of the mesh frequency and its harmonics that are related to the rotational speed.
As gear rotational speed increases or the number of teeth rises, the gear mesh frequency and its higher order harmonics quickly extend into the high frequency range, placing greater demands on the upper frequency response of vibration sensors. If the sensor’s frequency response is insufficient, higher order mesh frequencies and their sideband information will be attenuated or even remain unacquired, directly affecting the accuracy of gear fault detection.
This issue is particularly prominent in high-speed or speed-increasing gear transmission systems. For example, the gear speed-increasing boxes of doubly-fed wind turbines or the chlorine compressors in chlor-alkali chemical plants often have gear mesh frequencies and harmonic components distributed in relatively high frequency ranges. To achieve comprehensive monitoring of faults such as gear wear, engineering practice typically employs vibration sensors with an upper frequency response of no less than 10 kHz, ensuring that the gear mesh frequency and its higher order characteristics are effectively captured.
4. Electrical faults
In practical applications, electrical issues in motors are relatively common. When a motor experiences an electrical fault, it often generates abnormal electromagnetic vibrations, and these abnormal vibration frequencies may appear in the high frequency range of the spectrum. Taking rotor bar looseness as an example, when the contact condition between the rotor bars and the end rings changes, the rotor current distribution becomes uneven, and the air gap magnetic field undergoes periodic modulation as the rotor rotates. In the vibration spectrum, the rotor bar passing frequency and its associated modulation characteristics can usually be observed, accompanied by sideband structures on either side of this frequency at intervals of twice the supply frequency (Rotor Bar Passing Frequency=Number of Rotor Bars × Rotor Rotational Speed).
For a 2-pole variable-frequency motor from a Renke client, with a supply frequency of 35 Hz, the vibration spectrum under an electrical fault (rotor bar looseness) is shown below.
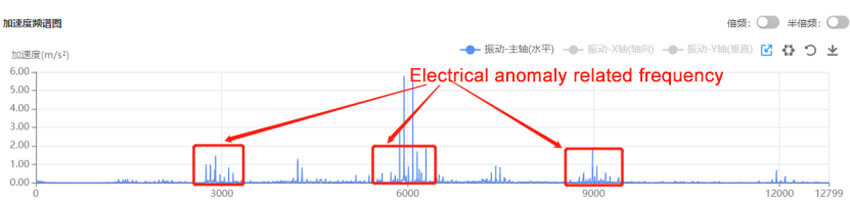
The figure shows that the highest frequencies associated with the electrical fault reach approximately 9 kHz. Only sensors with a true frequency response of at least 10 kHz can effectively detect these high frequency components related to electrical abnormalities.
Conclusion
A comprehensive analysis of the vibration characteristics associated with bearing faults, gear faults, and motor electrical faults shows that the characteristic frequency distributions excited by different fault types span a wide range. A substantial portion of critical fault information is concentrated in the mid frequency and even high frequency regions. Therefore, vibration monitoring sensors with a sufficiently high frequency response range are capable of effectively acquiring and analyzing the characteristic frequencies associated with most equipment faults. This helps prevent the loss of critical information caused by insufficient frequency response and, in turn, reduces the risk of missed detections or misdiagnosis.
Nyquist-Shannon Sampling Theorem
Proposed by E. T. Whittaker (1915), Kotelnikov (1933), and Shannon (1948), the sampling theorem is a fundamental principle in digital signal processing that describes the relationship between continuous-time signals and discrete-time signals. The theorem states that when the sampling frequency fs is greater than twice the highest frequency fmax present in the signal (fs>2fmax), the sampled discrete signal can fully preserve the information of the original signal without causing frequency aliasing.
In practical engineering applications, to account for the influence of the transition band of the anti-aliasing filter, the sampling frequency is typically set to 2.56 to 4 times the highest frequency of interest, ensuring that the signal can be reliably acquired and analyzed.
Anti-Aliasing Filter
An anti-aliasing filter is a low pass filter installed at the front end of an analog signal acquisition system. Its purpose is to suppress signal components whose frequencies exceed the range that the sampling system can properly process. In engineering measurements, because the sampling frequency is finite, high frequency signal components above half of the sampling frequency will produce aliasing after sampling. By filtering out frequency components higher than one half of the sampling frequency before sampling, aliasing can be effectively avoided, thereby ensuring the accuracy of the acquired data.
Gear Mesh Frequency(GMF)
The gear mesh frequency refers to the characteristic frequency generated by the periodic contact of gear teeth during the meshing process. As the meshing position, contact stiffness, and load vary periodically over time, this periodicity is reflected in the vibration signal as the mesh frequency and its higher-order harmonics. The gear mesh frequency is typically equal to the product of the gear rotational frequency and the number of teeth, and it is one of the core characteristic frequencies in gear fault analysis.
This article was written by the Renke Technical Team. The team focuses on collecting, analyzing, and addressing real customer challenges, and shares practical solutions through technical articles to help other users solve similar problems. Renke is a trusted sensor manufacturer with more than 15 years of hands on experience in hardware and software research and development. The company designs and produces a wide range of environmental monitoring sensors that are widely deployed across global markets. Supported by extensive field application experience and continuous technological innovation, we provide reliable and experience based insights into the development of Internet of Things and sensor technologies.