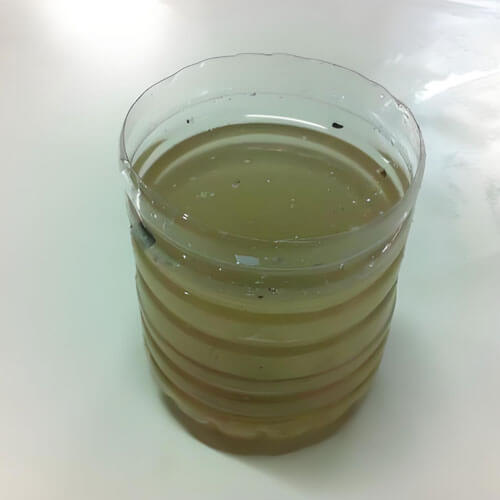
Total suspended solids (TSS) in water consist of a wide range of particulate materials, including microorganisms such as bacteria and algae, as well as inorganic particles like clay, silt, sand, and gravel. These particles vary in size, density, and settling behavior, which determines how long they remain suspended in water.
The primary drivers of elevated total suspended solids levels include natural processes such as soil erosion, runoff, and sediment disturbance, as well as human activities including agriculture, construction, and industrial discharge. Additionally, contaminants such as heavy metals and pathogens can attach to suspended particles, amplifying the environmental and health risks associated with high TSS concentrations.
In practical water quality monitoring, TSS is not just a measure of visual turbidity but a key indicator of ecological stability, sediment transport dynamics, and pollution loading in aquatic systems.
What is total suspended solids?
Total suspended solids (TSS) are the total amount of insoluble solid particles suspended in water, typically including silt, clay, algae, and organic debris larger than 2 micrometers. These particles usually have a density greater than water, allowing them to remain suspended in flowing water but gradually settle under still conditions. TSS can be measured by filtering the water through a 0.45 μm membrane, drying the filter at 100 °C, and weighing the retained solids. The results, expressed in mg/L, indicate water turbidity and pollution levels.
Why total suspended solids data is often misinterpreted
At first glance, it seems logical to assume that higher Total Suspended Solids (TSS) always indicates worse water quality. In reality, this assumption is overly simplistic and can be misleading. TSS represents the combined mass of all suspended particles in water, including fine clay, silt, sand, algae flocs, and even organic debris. Each type of particle interacts differently with your measurement method and water conditions, meaning that identical total suspended solids values can reflect very different water quality situations. Misinterpretation of TSS often arises from several common sources:
1. Different measurement methods
You may use either laboratory gravimetric methods or online optical sensors, and the readings can differ significantly.
Example: A wastewater plant measured the same sample using both methods. The lab gravimetric TSS was 120 mg/L, while the optical sensor reported 140 mg/L. The discrepancy occurred because the water contained fine algae flocs, which scatter light more efficiently than their mass alone would suggest.
2. Sampling inconsistencies
Where and how you collect water samples matters greatly. Suspended solids are not uniformly distributed in many water. Heavier particles tend to settle near the bottom, while lighter particles remain in suspension near the surface. Collecting water only from the surface may underestimate TSS, particularly after a rain event or during low flow periods. Grab samples taken at a single point may not reflect the average TSS across a channel, tank, or river cross-section.
Example: In a river monitoring project, surface samples showed TSS around 50 mg/L, while samples taken from mid-depth averaged 75 mg/L, and near the bottom were over 100 mg/L. If only surface samples were used, engineers might have underestimated sediment transport and erosion risk.
3. Environmental effects
Total suspended solids readings are sensitive to short-term environmental changes, which are often mistaken for water quality problems. Such as: rainfall and stormwater runoff can cause sudden spikes in total suspended solids unrelated to upstream processes. Algal blooms or decaying vegetation can increase organic particle content rapidly. Resuspension events, like boat traffic or sediment disturbances, can temporarily elevate total suspended solids even in otherwise stable water.
Example: After a moderate rainstorm, a treatment plant’s TSS sensors spiked from 80 mg/L to 160 mg/L for two hours. On inspection, it was clear the spike was caused by stormwater inflow, not a process failure. Acting without trend analysis would have led to unnecessary chemical dosing and operational adjustments.
4. Human factors and operational practices
Even experienced operators can misinterpret total suspended solids without standardized procedures:
- Inconsistent sample handling (delayed filtration, improper mixing) can change measured total suspended solids.
- Neglecting calibration of sensors leads to drift over time.
- Ignoring historical trends can make normal seasonal variation appear as abnormal spikes.
Example: A plant ignored the sensor’s monthly calibration schedule. Over three months, readings gradually drifted 10%~15%, making normal TSS appear elevated. Correcting the sensor revealed actual total suspended solids within acceptable limits.
How is total suspended solids (TSS) measured?
1. Gravimetric method
The gravimetric method is the most fundamental approach for total suspended solids determination. In laboratory analysis, water samples are typically filtered through binder-free glass fiber filters with a nominal pore size of about 1.5 µm, which retain suspended particles on a pre-weighed filter. The filter is then dried under specified temperature conditions and weighed again. By combining the mass difference of the filter before and after filtration with the filtered sample volume, the mass concentration of total suspended solids can be calculated. Because this method is directly based on the principle of mass conservation, the results show high traceability and comparability. For this reason, it is widely included in national and international water quality standards and serves as the reference method and calibration benchmark for total suspended solids measurements.
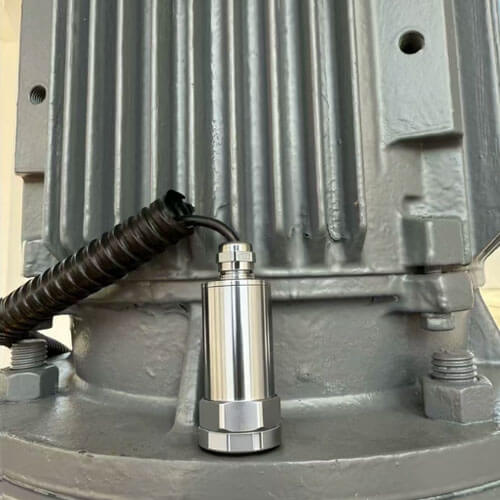
2. Optical scattering method
With the growing demand for online water quality monitoring, optical-based measurement techniques have become the mainstream in engineering applications. Among them, optical scattering is the most widely used principle in online TSS sensors. When a light beam enters water, suspended particles cause the light to scatter. The intensity of the scattered light is closely related to particle concentration, size, and optical properties. By detecting scattered light at specific angles (such as 90° or backscatter), the TSS concentration can be calculated. This method features fast response and supports continuous monitoring, making it well suited for applications such as wastewater treatment plant influent and effluent, river cross-sections, and industrial discharge outlets. However, it should be noted that optical scattering is inherently an indirect measurement method, and its results can be influenced by changes in particle size distribution, color, and composition.
3. Optical transmission method
The optical transmission method reflects suspended solid concentration by measuring the attenuation of light as it passes through water. As total suspended solids concentration increases, the transmitted light intensity decreases in a predictable manner. By establishing a relationship between light attenuation and TSS, concentration measurement can be achieved. This method performs relatively well under high suspended solid concentrations and is commonly used for highly turbid industrial wastewater or slurry systems. However, under low-concentration conditions, the change in light attenuation is less pronounced, resulting in lower sensitivity and resolution compared with scattering-based methods.
4. Remote sensing method
For large-scale water environment assessments, remote sensing techniques have also been introduced into suspended solids monitoring. By acquiring spectral reflectance data of water bodies using satellites or unmanned aerial vehicles and applying inversion models, total suspended solids levels can be estimated in lakes, estuaries, and coastal areas. This approach offers wide spatial coverage and is suitable for macroscopic monitoring and long-term trend analysis. However, its accuracy is strongly affected by water color, atmospheric conditions, and model parameters, and it usually relies on in situ total suspended solids measurements for calibration.
What factors affect the measurement of total suspended solids (TSS)?
When you measure total suspended solids in real water bodies, the result is shaped by far more than just particle concentration. Several physical and environmental factors directly influence how TSS is detected and reported.
Particle size distribution is one of the most important variables. Fine particles remain suspended longer and interact with light differently than coarse particles. In optical measurements, fine particles often produce stronger signals per unit mass, while larger particles may settle quickly and be underrepresented depending on sensor placement and flow conditions.
Particle composition also matters. Organic particles, such as algae or bioflocs, have different optical and density characteristics than inorganic sediments. Two samples with the same mass concentration can produce different total suspended solids readings if their particle makeup differs.
Hydraulic conditions further complicate measurements. Flow velocity, turbulence, and stratification influence whether particles stay evenly suspended. In slow or layered flows, suspended solids may not be uniformly distributed, meaning your measurement reflects local conditions rather than the entire water body.
Environmental interference plays a significant role in continuous monitoring. Color, dissolved organic matter, air bubbles, and biofouling can all affect optical signal stability. Over time, sensor drift caused by fouling or window contamination can introduce gradual bias if not properly managed.
For this reason, experienced practitioners treat total suspended solids measurements as context-dependent indicators, not absolute truths. Reliable total suspended solids monitoring requires proper sensor selection, thoughtful installation, and calibration strategies tailored to the specific water conditions being measured.
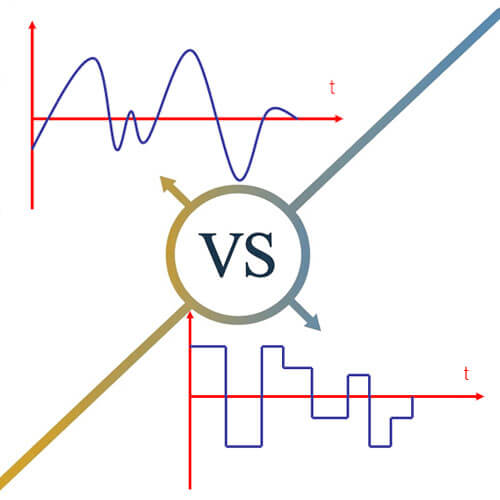
Total suspended solids values reflect trends rather than absolute conditions.
In practical water quality monitoring, total suspended solids (TSS) values are often more suitable for identifying trends rather than serving as absolute judgment criteria. This is not due to insufficient measurement accuracy, but rather to the physical nature of what TSS represents and the way it is measured.
Total suspended solids reflects the combined state of suspended particles in water at a specific moment, and this result is influenced by hydraulic conditions, operating load, external disturbances, and process stages. Even when the overall system operation remains fundamentally unchanged, total suspended solids may still fluctuate naturally within a certain range. Therefore, directly labeling a single instantaneous total suspended solids value as “good” or “bad” is not logically sound.
Trend analysis is more meaningful because it interprets total suspended solids within a time dimension. The direction, rate, and persistence of change shown by continuous data reveal how the system responds to disturbances. When a system is operating stably, TSS typically fluctuates around a baseline range; when internal or external conditions change, this fluctuation pattern shifts accordingly. It is this “change” rather than any single value, that carries real monitoring significance.
This article was written by the Renke Technical Team, a professional engineering group specializing in the design, research, and manufacturing of environmental monitoring instruments. Renke is a trusted sensor manufacturer with over 15 years of hands-on experience in both hardware and software R&D. The company develops and produces a wide range of water quality sensors, which are widely deployed in wastewater treatment plants, hydrological monitoring systems, environmental protection projects, and aquaculture operations worldwide. Backed by long-term field applications and continuous technological innovation, the Renke Technical Team provides reliable, experience-driven insights into water quality monitoring and sensor technology.